Carbon Footprint by Country: Causes, Effects, and What the World Must Do
- Dean Rusk Delicana
- May 7
- 9 min read

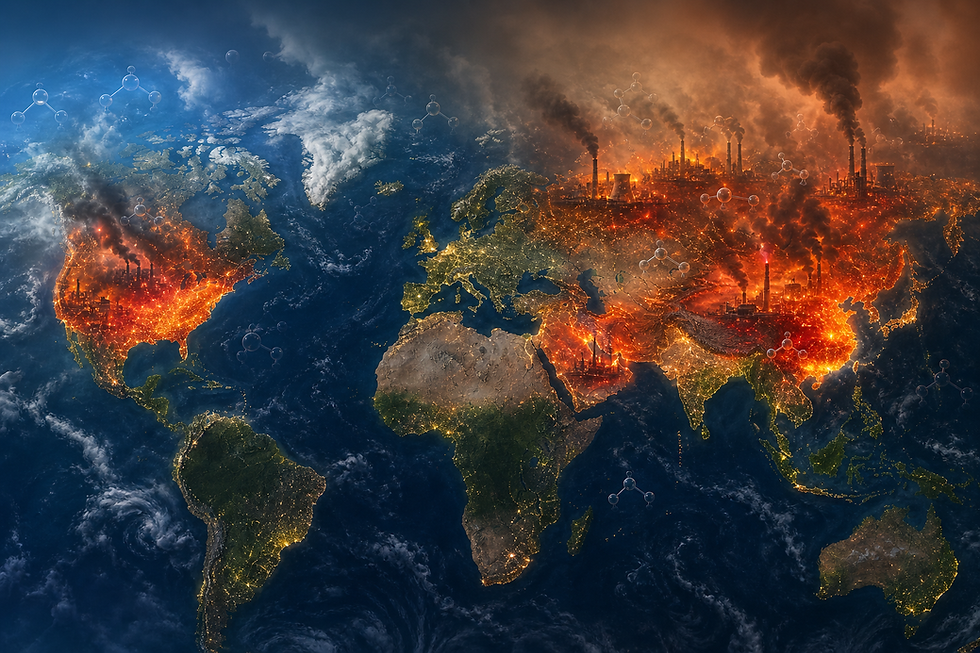
What Is a Carbon Footprint? A Clear Definition
Every action we take leaves a mark — not just on our personal lives, but on the planet. A carbon footprint is the total amount of greenhouse gases, including carbon dioxide and methane, that are generated by our actions. It calculates overall greenhouse gas (GHG) emissions from all direct and indirect sources, measured in units of CO₂ equivalent (CO₂e).
A carbon footprint estimates the total emission volume of greenhouse gases — those gases in our atmosphere that trap and release heat, and contribute to climate change. While the measurement accounts for a number of different world-warming gases — like methane, nitrous oxide, and fluorinated gases — results are typically expressed in terms of carbon dioxide equivalency.
Simply put, whether you're driving a car, buying a piece of clothing, or eating a meal, you're contributing to your carbon footprint. The same is true for businesses, industries, and entire nations.
The Greenhouse Gases Behind the Carbon Footprint
Not all greenhouse gases are equal. Carbon dioxide (CO₂) is the heaviest GHG emitted through human activities and what primarily drives climate change, remaining in the atmosphere for a long time. Sources include deforestation, fossil fuel combustion, and industrial processes. Methane (CH₄) is much more efficient at trapping heat and, though it remains in the atmosphere for only about 12 years, it contributes significantly to near-term warming — with sources in agriculture, fossil fuel extraction, and landfills. Nitrous oxide (N₂O) is a strong greenhouse gas with a long-lasting environmental impact of around 114 years, and also plays a role in ozone layer depletion.
What Causes a Carbon Footprint? Key Drivers
1. Energy Consumption and Fossil Fuels
Carbon dioxide traps heat emitted by both the sun and the Earth's surface and releases that heat into our atmosphere. As we burn fossil fuels and cut down forests, high concentrations of greenhouse gases threaten to raise the average surface temperature of the planet to intolerable levels.
Atmospheric carbon dioxide levels have risen more than 40 percent since the middle of the 18th century, and climatologists estimate that current levels are as high as they've been in some 14 million years.
2. Transportation
Owning and regularly driving a car adds an average of 2.4 tons of CO₂-equivalent to your yearly footprint, while just a single transatlantic flight adds 1.6 tons. At the national level, countries with sprawling road networks and high car-ownership rates have measurably larger transportation-related emissions.
3. Home Heating and Cooling
Regularly heating and cooling your home adds roughly 1.5 tons of CO₂-equivalent to your annual footprint, because most homes are still powered by "dirty" energy sources such as coal and gas instead of renewable sources like solar and wind. A typical coal power plant produces about 870 grams of CO₂ per kilowatt of power, while wind power produces only about 11 grams.
4. Food and Agriculture
Eating meat adds about 0.8 tons to your annual carbon footprint. This has less to do with emissions from the animals themselves and more to do with the energy required to grow and harvest the crops that feed livestock.
5. Industrial Activity and Manufacturing
Heavy industries — steel, cement, chemicals — rely on combustion processes that generate enormous CO₂ emissions. As nations industrialize, their carbon footprints tend to expand rapidly unless clean energy alternatives are adopted in parallel.
The Effects of a Large Carbon Footprint
Environmental Consequences
As carbon dioxide levels continue to climb, fueling further temperature increases, the cumulative effects — including increased ocean acidification, rising sea levels, more frequent and intense storms, mass species extinctions, food scarcity, and greater economic inequality — will be felt worldwide.
Social and Economic Consequences
Carbon emissions don't just harm ecosystems — they harm people. Communities in low-lying coastal areas face displacement from rising seas. Agricultural communities suffer from drought and crop failure. The economic cost of climate-related disasters runs into the trillions of dollars globally each year, with the heaviest burden falling on the world's most vulnerable populations — people who, ironically, are often the least responsible for the emissions causing these crises.
The Feedback Loop Problem
One of the most alarming aspects of a growing carbon footprint is how self-reinforcing it becomes. Melting Arctic permafrost releases stored methane, which warms the planet further, melting more permafrost. Warming oceans absorb less CO₂, leaving more in the atmosphere. Every ton of emissions today makes tomorrow's problem harder to solve.
Carbon Footprint by Country: Who Emits the Most?
Global Emissions Snapshot
Global greenhouse gas emissions in 2024 reached 53.2 Gt CO₂eq (without Land Use, Land Use Change and Forestry), a 1.3% increase — or 665 Mt CO₂eq — compared to 2023. This upward trend is alarming given the urgent targets set by international climate agreements.
Fossil CO₂ emissions, which are the main contributors to global GHG emissions, are still increasing at the world level despite climate change mitigation agreements.
The Top Emitters by Total Volume
China leads global emissions at 33.98% of the world's total, with 9.24 tonnes of CO₂ per capita. The United States accounts for 12% of global emissions, with 13.83 tonnes per capita. India follows at 7.57%, with 2.07 tonnes per capita. Russia contributes 5.3%, with 14.45 tonnes per capita.
China, the United States, India, the EU27, Russia, and Indonesia are among the top emitters globally.
The Top Emitters by Per Capita Output
Total volume tells one story; per capita figures tell another — and often a more revealing one. Palau tops the per capita rankings at 62.59 tonnes per person, followed by Qatar at 43.55 tonnes and Kuwait at 24.90 tonnes. Brunei follows at 21.12 tonnes per capita.
Around the world, the average person generates 4.8 metric tons of carbon dioxide emissions each year. In the United States, it's more than three times that — 16.2 metric tons. The U.S.'s per capita carbon footprint is larger than that of most nations, including Canada (15.64 t), Russia (11.76 t), Germany (9.73 t), Japan (9.45 t), China (6.98 t), UK (5.81 t), France (5.48 t), Brazil (2.27 t), and India (1.84 t).
Deep Dive: High Carbon Footprint Countries
China — The World's Largest Total Emitter
Causes: China's dominant position in global manufacturing, its enormous coal-fired power sector, and the rapid industrialization of its interior provinces all drive outsized emissions. Since the beginning of the 21st century, global GHG emissions had followed an increasing trend mainly due to the increase in emissions from China and other emerging economies.
Effects: China experiences severe air pollution in its industrial cities, threatening public health. It also faces acute pressure from climate-related flooding in the south and desertification in the north.
Solutions: China has made significant pledges — including carbon neutrality by 2060 — and is now the world's largest installer of solar and wind capacity. Enforcement of these targets and a faster coal phase-out remain critical next steps.
The United States — The Largest Per Capita Emitter Among Major Economies
Causes: According to data from the World Bank, the United States has one of the highest per capita carbon footprints globally, primarily due to its reliance on fossil fuels for energy. Car-dependent urban design, high energy consumption in homes and commercial buildings, and heavy aviation use all contribute.
Effects: The U.S. increasingly faces the economic cost of its own emissions — in the form of more intense hurricanes along its Gulf and Atlantic coasts, prolonged droughts in the West, and devastating wildfires.
Solutions: Federal investments in clean energy through legislation such as the Inflation Reduction Act (IRA) represent meaningful steps. The transition to electric vehicles, grid modernization, and building retrofitting are critical levers.
India — A Rising Emitter With a Development Imperative
Causes: India's carbon footprint is driven by rapid population growth, coal-fired power generation, expanding manufacturing, and growing transportation infrastructure. India's energy-hungry economy relies heavily on coal for electricity generation, though it is rapidly expanding its renewable energy capacity.
Effects: India is acutely vulnerable to climate impacts it has done little to cause — including extreme heat waves, intensifying monsoons, and glacial retreat in the Himalayas that threatens the freshwater supply of hundreds of millions.
Solutions: India has committed to 500 GW of renewable energy capacity by 2030. International financial support for clean energy transitions is essential for countries like India to develop without repeating the high-carbon path of wealthier nations.
Russia — A Fossil Fuel Economy Under Climate Pressure
Causes: Russia's economy is built around oil, gas, and coal extraction and export. Its vast and cold geography means home heating demands are enormous, and industrial efficiency lags behind Western Europe.
Effects: Russia is warming at two to three times the global average rate, leading to permafrost thaw that threatens infrastructure built on frozen ground and releases stored methane — a dangerous feedback loop.
Solutions: Diversification away from fossil fuel dependence, improved industrial energy efficiency, and engagement with global climate finance mechanisms are the primary pathways.
Qatar and Kuwait — Small Nations, Massive Per Capita Footprints
Causes: The Gulf states' extreme per capita figures reflect oil and gas extraction economies, extreme air conditioning demands in desert climates, and subsidized energy prices that discourage conservation. Qatar's per capita footprint stands at 43.55 tonnes and Kuwait's at 24.90 tonnes — figures that dwarf those of even the most industrialized Western nations.
Effects: Despite their wealth, these nations face existential threats from rising heat that could make outdoor life in the region dangerous for parts of the year.
Solutions: Gulf states are investing in solar energy and hydrogen production, and some are beginning to reform energy subsidies — changes that, if sustained, could dramatically reshape their emissions trajectories.
What Countries With Low Carbon Footprints Do Differently
Countries like Bhutan, Paraguay, and many nations in sub-Saharan Africa have very low per capita footprints — some even achieving carbon neutrality. Many African countries have significantly lower emissions due to limited industrialization and resource consumption. However, it's important to distinguish between low emissions by design versus by poverty. The goal for every nation must be high human development with low carbon intensity — not simply low development.
Countries like Denmark, Sweden, and Costa Rica demonstrate that prosperity and low emissions can coexist when clean energy, public transit, and strong environmental policy are prioritized.
How to Reduce a Carbon Footprint: Solutions at Every Level
At the Individual Level
Drastically cutting greenhouse gas emissions will require everyone — from individuals to industries to countries — to vastly reduce their carbon footprint. On a personal level, this means: choosing public transportation or electric vehicles; reducing meat consumption, especially beef; improving home energy efficiency; and being mindful of consumption and waste.
At the Corporate Level
Businesses are responsible for a significant share of global emissions — both directly through operations and indirectly through supply chains. Carbon accounting, science-based emissions targets, investment in renewable energy, and transparent disclosure are now baseline expectations for responsible corporations.
At the National and Policy Level
Governments hold the most powerful levers: carbon pricing, regulatory standards, public investment in clean infrastructure, and international climate diplomacy. The Paris Agreement framework and its successor commitments create accountability mechanisms — but only if countries follow through on their pledges.
Natural Climate Solutions
To halt climate breakdown, we need to shift to a low-carbon economy and protect our best natural allies in the fight against climate change — forests, grasslands, mangroves, and tidal marshes, which store large quantities of carbon. Protecting and restoring these ecosystems is one of the most cost-effective climate solutions available.
Why Carbon Footprint Is Everyone's Business
It can be tempting to see climate change as a problem for governments, scientists, or the biggest polluters to solve. But the carbon footprint concept exists precisely because it connects every one of us — from the smallest individual action to the largest national policy — to the shared atmosphere we all breathe.
Once we identify the immensity and source of emissions, companies, individuals, governments, and other stakeholders can take targeted measures to minimize their environmental impact.
There is also the matter of justice. The communities most devastated by climate change — small island nations, subsistence farmers, coastal megacities in the developing world — are often those that have contributed the least to the problem. This moral reality means that reducing carbon footprints is not merely an environmental task. It is an act of global solidarity.
The choices nations make about energy, transportation, agriculture, and industry in this decade will shape the climate trajectory for centuries. And the choices individuals make — as consumers, voters, and community members — shape the political will that drives national action.
Carbon footprint is not a niche concept for environmental scientists. It is the central metric of our shared planetary future. Understanding it, measuring it, and reducing it is everyone's business — and everyone's responsibility.
🌍 Bring This Conversation Into the Classroom
If reading this article made you think, "My students need to understand this" — you're right. And the good news is, you don't have to build the lessons from scratch.
The Carbon Footprint Education Bundle gives Grades 3–5 teachers everything they need to teach this topic with confidence — five fully written lesson plans, printable student worksheets, classroom display posters, assessment tools, and even an interactive carbon footprint calculator. It's all ready to download, print, and teach — no prep stress required.
Not sure if it's the right fit? There's a free preview available so you can check the quality before you commit to anything.
Because the next generation of climate problem-solvers is sitting in your classroom right now — they just need someone to show them where to start.
References
Britannica. Carbon Footprint | Definition, Examples, Calculation, Effects, & Facts. https://www.britannica.com/science/carbon-footprint
Conservation International. What Is a Carbon Footprint? https://www.conservation.org/learning/what-is-a-carbon-footprint
Carbon Trail. Carbon Footprint – What Is a Carbon Footprint and Why Is It Important? https://carbontrail.net/blog/carbon-footprint-what-is-a-carbon-footprint-and-why-is-it-important/
Natural History Museum. What Is a Carbon Footprint? https://www.nhm.ac.uk/discover/quick-questions/what-is-carbon-footprint.html
World Population Review. Carbon Footprint by Country 2026. https://worldpopulationreview.com/country-rankings/carbon-footprint-by-country
EDGAR – Emissions Database for Global Atmospheric Research. GHG Emissions of All World Countries – 2025 Report. https://edgar.jrc.ec.europa.eu/report_2025
The Eco Shift. Carbon Footprint by Country: Global Rankings and Regional Insights. https://theecoshift.com/per-capita-carbon-footprint-by-country/
Ecologic Life. How Carbon Footprint Affects the Environment. https://ecologiclife.com/the-impact-of-carbon-footprints-on-the-environment.html
Findings.co. Impacts of Carbon Footprints: Social & Environmental Consequences. https://findings.co/impacts-of-carbon-footprints/


Comments